Polyploidbreeding
PRIN 2022 (Settore LS2)
Start date: 28 September 2023
End date: 27 February 2026

Latest from the project
Article published in the journal Drones
Our Technical Note “drone2report: A Configuration-Driven Multi-Sensor Batch-Processing Engine for UAV-Based Plot Analysis in Precision Agriculture” has been published in the journal Drones (on-line version here).
This article presents the functionalities of the software drone2report, developed within the Polyploidbreeding 4.0 project. Drone2report reads images from drone (UAV: unmanned aerial vehicle) phenotyping and does several things, e.g. calculating vegetation indices or implementing machine-learning classification or predictive models.
A few use-cases are illustrated:
- Thresholding
- Monitoring vegetation indices over time
- Analysis of height from DEM files
- Index optimization on images merged from heterogeneous sensors
- Deep Learning for image classification
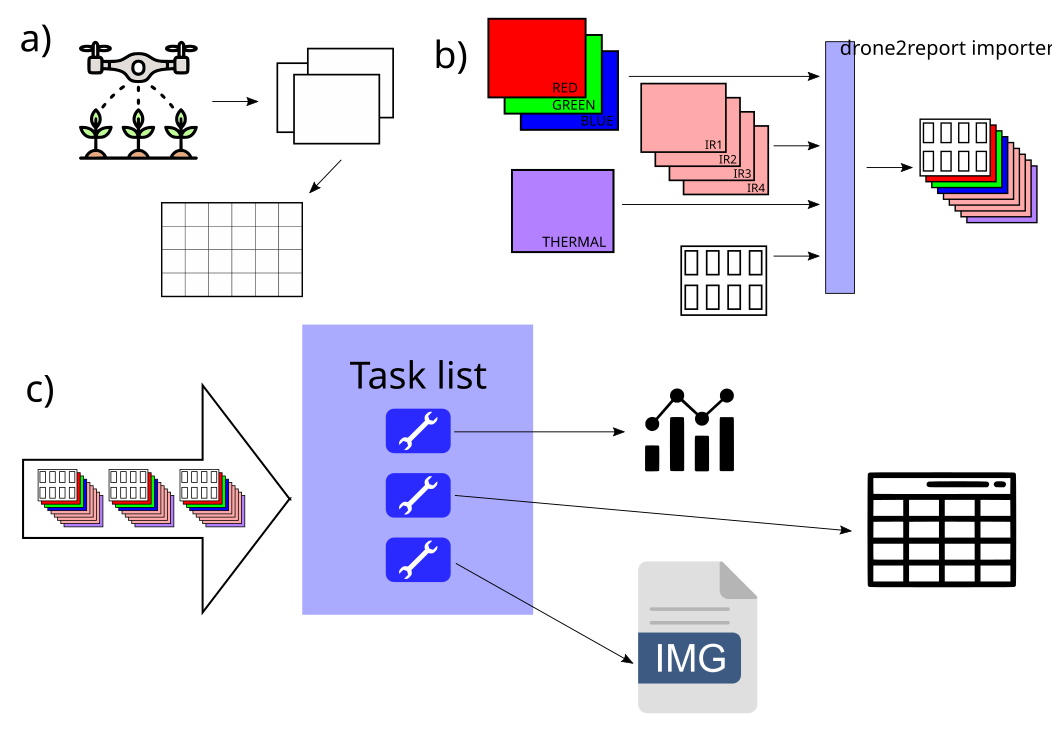
Figure: General workflow. Panel (a): drones capture raw, partial images of the field (depending on the mounted sensors). All images from a single flight are collated in a unique orthomosaic. Panel (b): orthomosaics coming from one or more sensors, together with a shape file that specifies the ROIs, enter drone2report and are converted to an internal dataset object. Panel (c): all datasets are input, in turn, to all queued tasks, each task producing its specific output (e.g., tables, other images, etc.).